Back to Templates

🚀 Your n8n Workflows Monitoring Best Practices Template
Are you running critical processes in n8n and relying on hope that they finish successfully? Stop guessing and start monitoring.
This template demonstrates best practices for monitoring your n8n workflows using the Watchflow node. It shows you exactly how to implement robust error catching, data aggregation, and dead man's switch logic to ensure your automation engine never fails silently.
For a deeper dive into these strategies, check out our guide on n8n Monitoring Use Cases.
💎 Why You Need These Monitoring Practices
Simply knowing a workflow ran isn't enough. Did it actually process any data? Did an API silently return zero results? Did a specific node crash without you noticing?
This template teaches you how to:
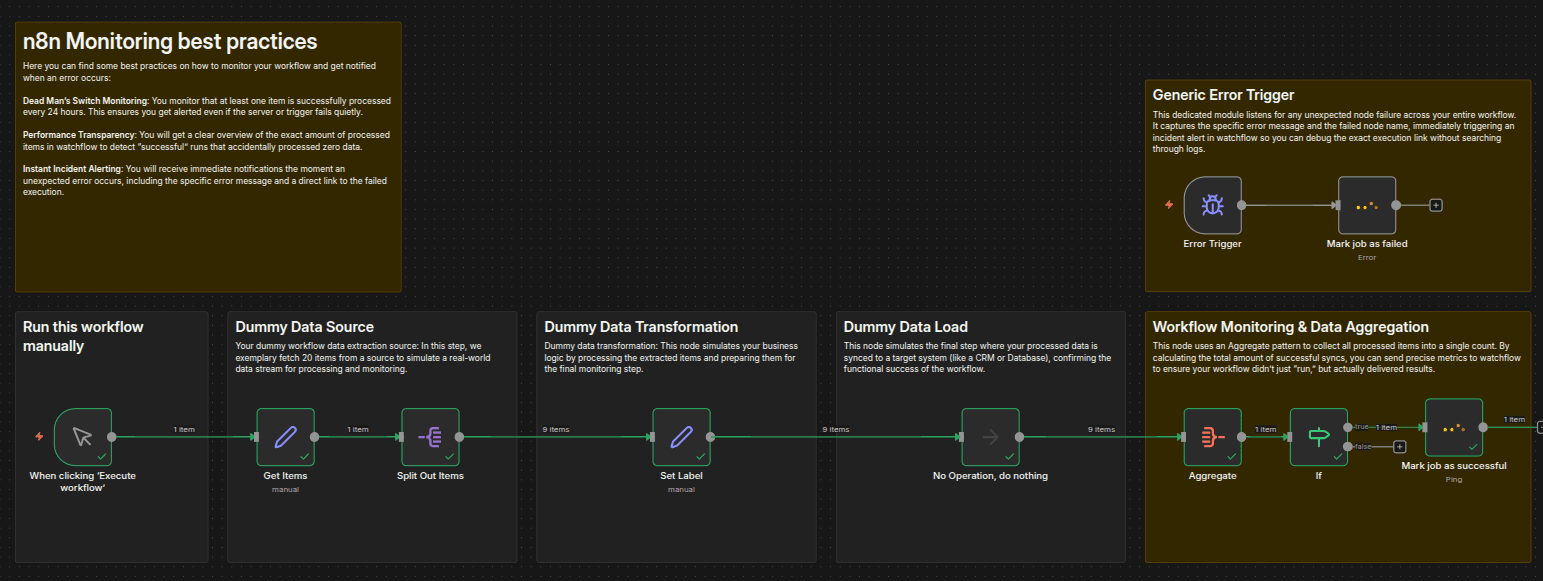
- Implement a Dead Man’s Switch: Monitor that at least one item is successfully processed on schedule. Get alerted even if your trigger or server fails quietly.
- Ensure Performance Transparency: Aggregate your results to see the exact number of processed items. Easily detect "successful" runs that accidentally processed zero data.
- Set Up Instant Incident Alerting: Receive immediate notifications the moment an unexpected error occurs, including the specific error message and a direct link to the exact failed execution.
🛠️ What’s Under the Hood?
This template provides a clear, annotated example of a simulated workflow, paired with robust monitoring logic:
- Simulated Data Pipeline: Follows a standard Extract-Transform-Load (ETL) pattern, fetching dummy items, transforming them, and simulating a final load step.
- Data Aggregation & Validation: Instead of just finishing the execution, the workflow uses an
Aggregatenode to count the exact number of successful items processed. - The Watchflow Success Ping: If items were processed successfully, it sends a precise "Success" heartbeat to Watchflow, logging the exact item count metric.
- Global Error Handler (Error Trigger): This template utilizes n8n's native built-in
Error Triggernode. Instead of configuring custom error-handling "Continue on Fail" logic for every single node, this trigger acts as a global safety net. If any node in the workflow fails unexpectedly, the Error Trigger automatically catches the failure event and intercepts critical execution data (such as the detailed error message, the execution ID, the workflow ID, and the exact node that failed).- (Pro tip: You can save this error-handling sequence as its own workflow, and then go to Settings in all your other workflows to set it as your default "Error Workflow".)
- Instant Failure Reporting: The captured execution payload is instantly pushed to the Watchflow node. You receive an alert with the complete failure details and a direct link to the exact execution. No more digging through n8n execution histories—just click and debug.
⚡ Quick Start (Requirements)
To deploy these best practices in your own environment, you'll need:
- Watchflow Node: Install the official community node via npm:
@watchflow/n8n-nodes-watchflow. - Watchflow API Key: Sign up at watchflow.io, navigate to Settings, and grab your key from the API Key section.
- n8n API Key: In your n8n workspace, head to Settings -> n8n API to generate your key.
- (Tip for Credentials): When adding your n8n API credentials in Watchflow, ensure you append
/v1/apito your base URL (e.g.,https://n8n.yourdomain.com/v1/api).
📈 The Result? Total Observability.
Copy these patterns into your daily automations. Whether you're syncing customer data, updating CRMs, or handling billing syncs, implementing these Watchflow Monitoring Best Practices will transform your n8n instance from a black box into a highly transparent, fully observable system.